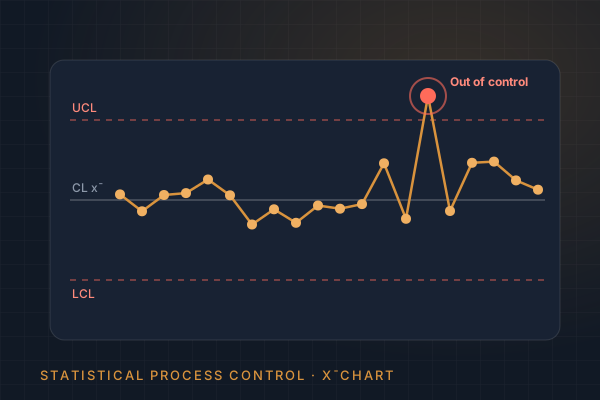
Statistical Process Control (SPC) is a method of monitoring and improving a production process using statistics. Instead of inspecting every part after it is made, SPC watches the process itself and signals when something has changed. It is one of the most cost-effective quality tools available to manufacturers of any size.
Why SPC matters
Every process varies. Two parts from the same machine are never exactly identical. SPC separates this variation into two types:
- Common-cause variation — the natural, random variation built into the process. It is predictable within limits.
- Special-cause variation — variation from a specific, identifiable source: tool wear, a new material batch, a changed setting, a different operator.
Reacting to common-cause variation (over-adjusting) makes a process worse. Ignoring special-cause variation lets defects through. SPC tells you which is which.
Control charts
The control chart is the core SPC tool. Measurements are plotted over time against three lines:
- Centre line (CL) — the process average.
- Upper control limit (UCL) and lower control limit (LCL) — usually set at ±3 standard deviations from the average, calculated from the process data.
Control limits describe what the process is doing; they are not the same as specification limits, which describe what the customer requires. A point outside the control limits, or a non-random pattern such as a run of points on one side of the centre line, indicates a special cause that should be investigated.
Common chart types
| Chart | Data type | Typical use |
|---|---|---|
| X̄–R chart | Variables, subgroups of 2–10 | Machined dimensions sampled every hour |
| X̄–S chart | Variables, larger subgroups | High-volume automated measurement |
| I–MR chart | Individual values | Low-volume production, batch processes |
| p / np chart | Proportion / count defective | Pass/fail inspection results |
| c / u chart | Defects per unit | Surface defects, weld defects |
Process capability: Cp and Cpk
Once a process is stable, the next question is whether it is capable of meeting the tolerance. Capability indices compare the spread of the process with the width of the specification:
- Cp = (USL − LSL) / 6σ — how wide the tolerance is compared with the process spread.
- Cpk = min(USL − μ, μ − LSL) / 3σ — the same, but taking into account how well the process is centred.
A Cpk of 1.33 or higher is a common minimum requirement in industry; automotive and other critical applications often require 1.67. A Cpk below 1.0 means the process will produce parts outside tolerance even when it is stable.
Stability first, capability second. Capability figures calculated from an unstable process are not meaningful.
How we implement SPC
- Select critical characteristics — the dimensions or parameters that matter most for function and customer requirements.
- Check the measurement system — confirm that gauges are suitable and repeatable before trusting the data.
- Collect baseline data and calculate control limits.
- Set up charts and reaction plans so operators know what to do when a signal appears.
- Analyse capability and report Cp/Cpk with recommendations.
- Review and improve — reduce variation and recalculate limits as the process improves.
Benefits of SPC
- Less scrap and rework, because problems are caught as trends rather than failures.
- Reduced inspection costs once processes are proven capable.
- Objective evidence of quality for customers and audits.
- Better understanding of machines, tools and suppliers.
SPC works best together with accurate dimensional inspection: reliable measurements are the foundation of every control chart.
Written by Abbas Ozden, CIO Inspection Ltd — quality control and inspection, Southend-on-Sea, Essex, United Kingdom.